C-LAMP Free Air CO2 Enrichment (FACE) Simulations
Forrest Hoffman and Jim Randerson
Updated September 9, 2008
Background
Websites
Papers
C-LAMP Experiment Descriptions
Global FACE Analysis
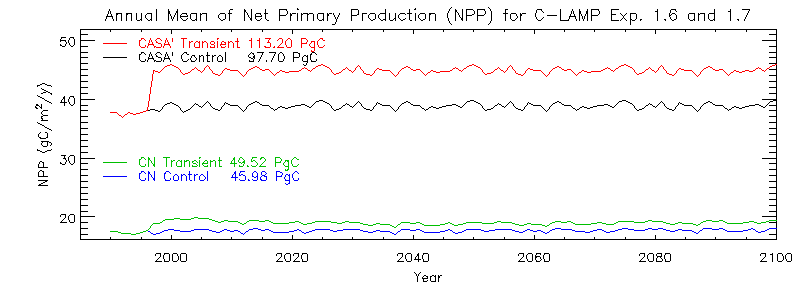
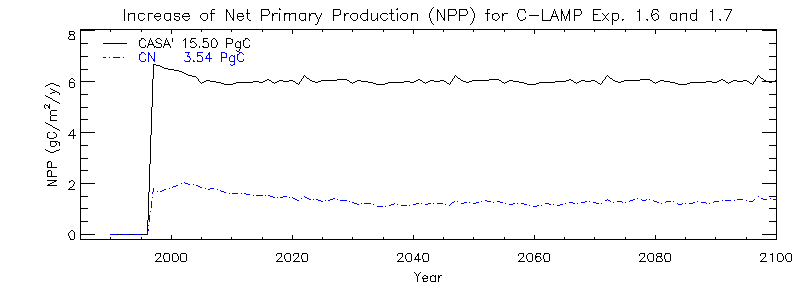
Dynamics of Global Carbon Fluxes
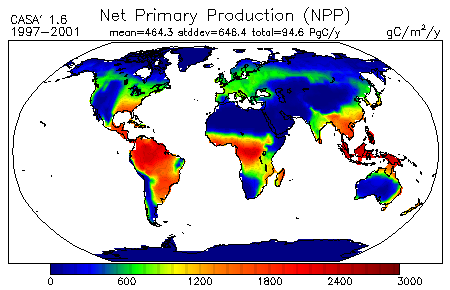
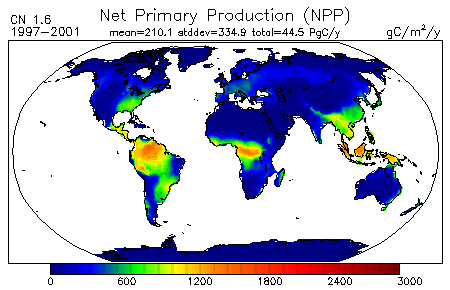
| Net Primary Production (NPP) |
 |
 |
|
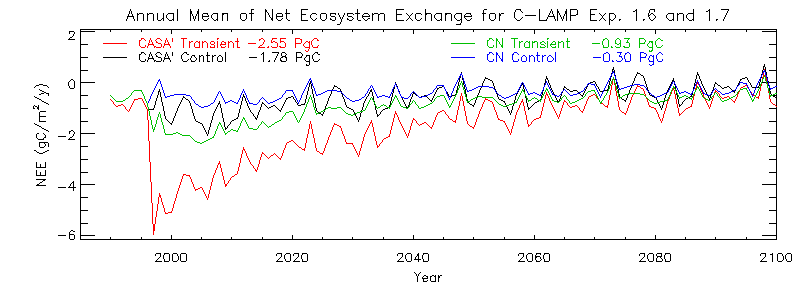
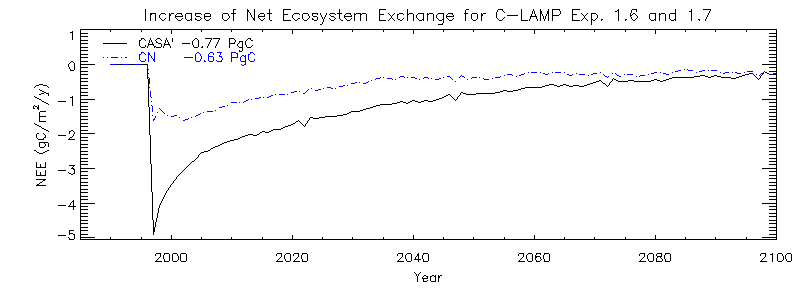
| Net Ecosystem Exchange (NEE) |
 |
 |
|
Net Primary Production (NPP) Response by Plant Functional Type (PFT)
| Number of Grid Cells |
Plant Functional Type |
CASA′ Model |
CN Model |
| Exp 1.6, 1997-2001 |
Exp 1.7, 1997-2001 |
Difference |
Exp 1.6, 1997-2001 |
Exp 1.7, 1997-2001 |
Difference |
| NPP (gC m-2 y-1) |
Total NPP (PgC y-1) |
NPP (gC m-2 y-1) |
Total NPP (PgC y-1) |
NPP mean increase |
βL |
Total NPP (PgC y-1) |
NPP (gC m-2 y-1) |
Total NPP (PgC y-1) |
NPP (gC m-2 y-1) |
Total NPP (PgC y-1) |
NPP mean increase |
βL |
Total NPP (PgC y-1) |
| mean |
standard
deviation |
mean |
standard
deviation |
mean |
standard
deviation |
mean |
standard
deviation |
| 676 |
not vegetated |
58.43 |
104.49 |
2.75 |
73.73 |
128.15 |
3.50 |
26.19% |
0.65 |
0.76 |
29.45 |
84.59 |
1.48 |
33.26 |
93.65 |
1.67 |
12.96% |
0.32 |
0.19 |
| 38 |
needleleaf evergreen temperate tree |
1332.66 |
328.49 |
2.35 |
1539.69 |
402.22 |
2.73 |
15.54% |
0.38 |
0.38 |
659.92 |
148.90 |
1.22 |
713.97 |
160.46 |
1.32 |
8.19% |
0.20 |
0.10 |
| 150 |
needleleaf evergreen boreal tree |
641.27 |
135.69 |
4.80 |
723.73 |
145.03 |
5.44 |
12.86% |
0.32 |
0.65 |
277.17 |
84.89 |
2.10 |
300.10 |
90.62 |
2.28 |
8.27% |
0.20 |
0.18 |
| 0 |
needleleaf deciduous boreal tree |
|
|
|
|
|
|
|
|
|
|
|
|
|
|
|
|
|
|
| 164 |
broadleaf evergreen tropical tree |
2186.85 |
231.90 |
25.39 |
2506.13 |
241.76 |
29.19 |
14.60% |
0.36 |
3.80 |
1178.80 |
210.14 |
14.04 |
1321.25 |
218.96 |
15.71 |
12.08% |
0.30 |
1.66 |
| 16 |
broadleaf evergreen temperate tree |
1400.37 |
397.32 |
0.95 |
1563.87 |
478.89 |
1.08 |
11.68% |
0.29 |
0.13 |
851.02 |
213.40 |
0.59 |
906.69 |
226.41 |
0.63 |
6.54% |
0.16 |
0.04 |
| 10 |
broadleaf deciduous tropical tree |
1571.34 |
227.32 |
1.12 |
1891.29 |
254.09 |
1.35 |
20.36% |
0.50 |
0.23 |
842.76 |
284.36 |
0.62 |
951.57 |
322.27 |
0.70 |
12.91% |
0.32 |
0.08 |
| 15 |
broadleaf deciduous temperate tree |
1039.47 |
200.82 |
1.02 |
1222.67 |
236.40 |
1.20 |
17.63% |
0.44 |
0.18 |
710.09 |
161.24 |
0.71 |
770.46 |
161.17 |
0.77 |
8.50% |
0.21 |
0.06 |
| 0 |
broadleaf deciduous boreal tree |
|
|
|
|
|
|
|
|
|
|
|
|
|
|
|
|
|
|
| 0 |
broadleaf evergreen shrub |
|
|
|
|
|
|
|
|
|
|
|
|
|
|
|
|
|
|
| 64 |
broadleaf deciduous temperate shrub |
350.97 |
223.33 |
1.65 |
450.51 |
271.65 |
2.12 |
28.36% |
0.70 |
0.47 |
102.26 |
86.50 |
0.49 |
114.51 |
105.55 |
0.55 |
11.98% |
0.30 |
0.06 |
| 347 |
broadleaf deciduous boreal shrub |
166.51 |
104.47 |
2.00 |
185.88 |
114.74 |
2.26 |
11.63% |
0.29 |
0.26 |
34.19 |
70.17 |
0.40 |
35.20 |
72.10 |
0.41 |
2.94% |
0.07 |
0.01 |
| 165 |
c3 arctic grass |
391.84 |
144.57 |
2.55 |
442.15 |
155.00 |
2.93 |
12.84% |
0.32 |
0.38 |
142.44 |
100.24 |
0.91 |
150.96 |
105.77 |
0.97 |
5.98% |
0.15 |
0.06 |
| 449 |
c3 non-arctic grass |
783.91 |
431.15 |
20.76 |
939.50 |
500.00 |
25.10 |
19.85% |
0.49 |
4.35 |
374.29 |
237.79 |
10.00 |
410.56 |
253.82 |
10.97 |
9.69% |
0.24 |
0.97 |
| 341 |
c4 grass |
1371.54 |
514.75 |
25.25 |
1608.62 |
571.96 |
29.67 |
17.29% |
0.43 |
4.42 |
517.30 |
342.57 |
9.50 |
576.19 |
384.98 |
10.56 |
11.38% |
0.28 |
1.06 |
| 71 |
corn |
818.24 |
280.34 |
4.04 |
970.73 |
319.56 |
4.81 |
18.64% |
0.46 |
0.77 |
488.09 |
195.36 |
2.41 |
515.54 |
203.15 |
2.54 |
5.62% |
0.14 |
0.13 |
| 0 |
wheat |
|
|
|
|
|
|
|
|
|
|
|
|
|
|
|
|
|
|
| 3492 |
Global |
464.30 |
646.36 |
94.62 |
542.89 |
747.65 |
111.37 |
16.93% |
0.42 |
16.75 |
210.08 |
334.92 |
44.46 |
231.61 |
371.18 |
49.07 |
10.25% |
0.25 |
4.60 |
| 1830 |
All Vegetated |
864.40 |
675.38 |
91.87 |
1008.70 |
776.86 |
107.87 |
16.69% |
0.41 |
16.00 |
390.00 |
378.45 |
42.99 |
429.66 |
420.74 |
47.40 |
10.17% |
0.25 |
4.41 |
| 393 |
Forests |
1422.87 |
730.17 |
35.63 |
1629.38 |
839.23 |
40.99 |
14.51% |
0.36 |
5.36 |
744.71 |
437.78 |
19.29 |
825.47 |
491.13 |
21.41 |
10.84% |
0.27 |
2.12 |
| 411 |
Shrubs |
195.23 |
146.14 |
3.65 |
227.09 |
177.99 |
4.38 |
16.32% |
0.40 |
0.73 |
44.79 |
76.91 |
0.89 |
47.55 |
83.24 |
0.96 |
6.15% |
0.15 |
0.07 |
| 955 |
Grasses |
925.99 |
561.36 |
48.56 |
1092.49 |
646.15 |
57.70 |
17.98% |
0.44 |
9.14 |
385.30 |
294.26 |
20.41 |
424.85 |
325.97 |
22.50 |
10.27% |
0.25 |
2.09 |
| 71 |
Crops |
818.24 |
280.34 |
4.04 |
970.73 |
319.56 |
4.81 |
18.64% |
0.46 |
0.77 |
488.09 |
195.36 |
2.41 |
515.54 |
203.15 |
2.54 |
5.62% |
0.14 |
0.13 |
| 69 |
Temperate Forests |
1284.62 |
345.74 |
4.32 |
1476.38 |
410.32 |
5.01 |
14.93% |
0.37 |
0.69 |
715.14 |
183.07 |
2.52 |
770.94 |
191.87 |
2.72 |
7.80% |
0.19 |
0.20 |
| 174 |
Tropical Forests |
2151.47 |
272.02 |
26.51 |
2470.79 |
281.12 |
30.54 |
14.84% |
0.37 |
4.02 |
1159.49 |
227.96 |
14.67 |
1300.00 |
240.87 |
16.41 |
12.12% |
0.30 |
1.74 |
| 150 |
Boreal Forests |
641.27 |
135.69 |
4.80 |
723.73 |
145.03 |
5.44 |
12.86% |
0.32 |
0.65 |
277.17 |
84.89 |
2.10 |
300.10 |
90.62 |
2.28 |
8.27% |
0.20 |
0.18 |
Global Maps of Net Primary Production (NPP) Response
| Net Primary Production (NPP) for Control Run (Experiment 1.6) |
 |
 |
|
| Net Primary Production (NPP) for Transient Run (Experiment 1.7) |
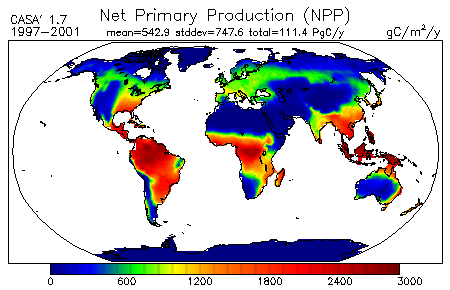 |
 |
|
| Difference in Net Primary Production (NPP) for Transient-Control (Experiment 1.7-Experiment 1.6) |
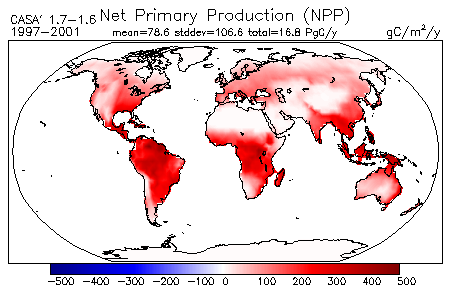 |
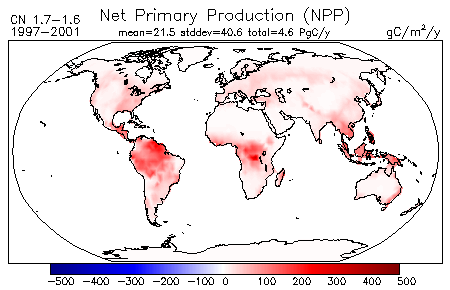 |
|
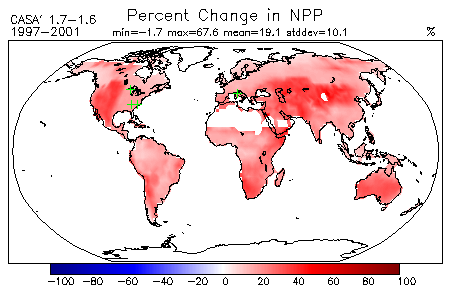
| Percent Change in Net Primary Production (NPP) Between Transient and Control |
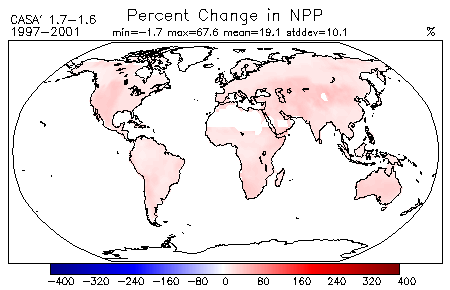 |
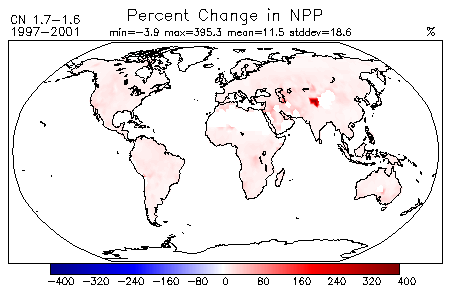 |
 |
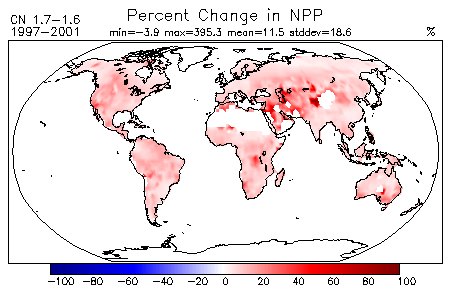 |
|
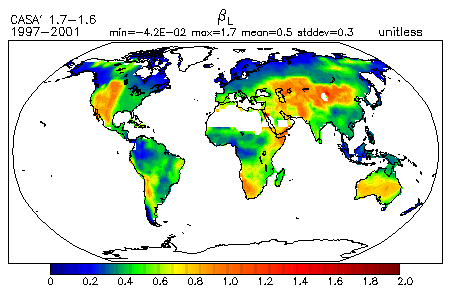
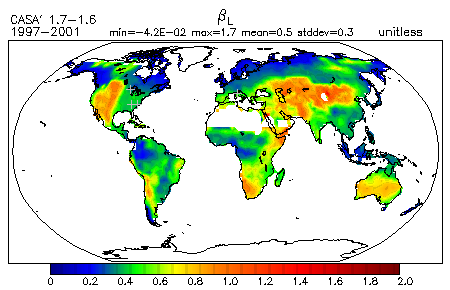
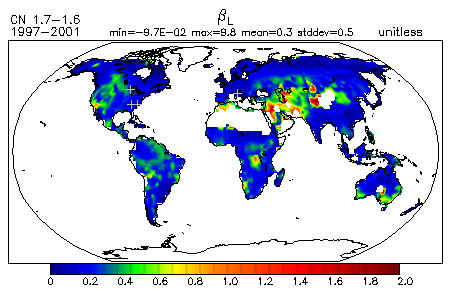
| βL Response Between Transient and Control |
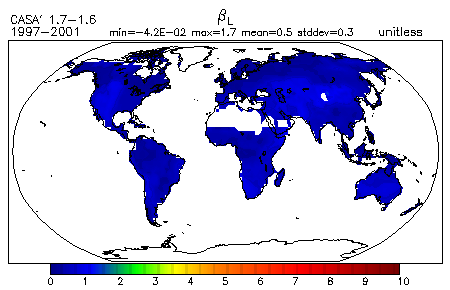 |
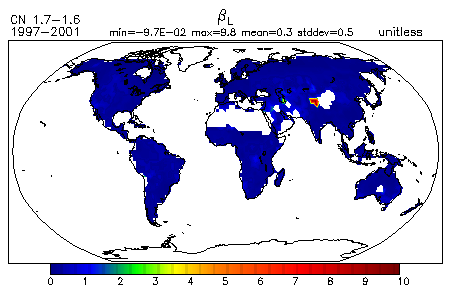 |
 |
 |
|
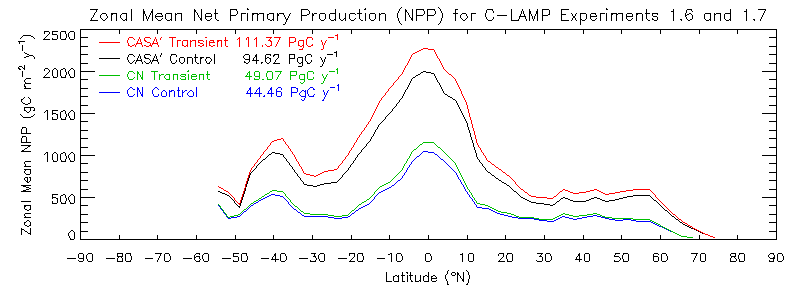
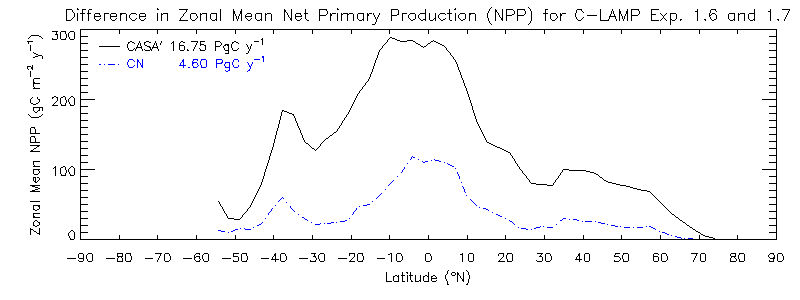
Zonal Mean Net Primary Production (NPP) Response
Dynamics of Global Carbon Stocks
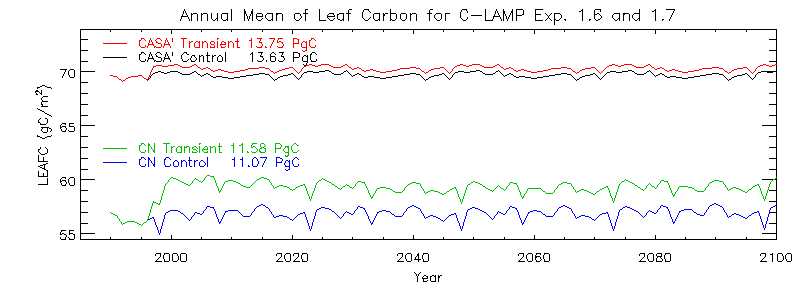
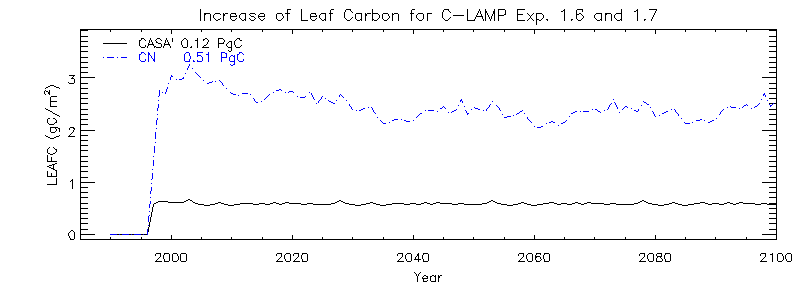
| Leaf Carbon |
 |
 |
|
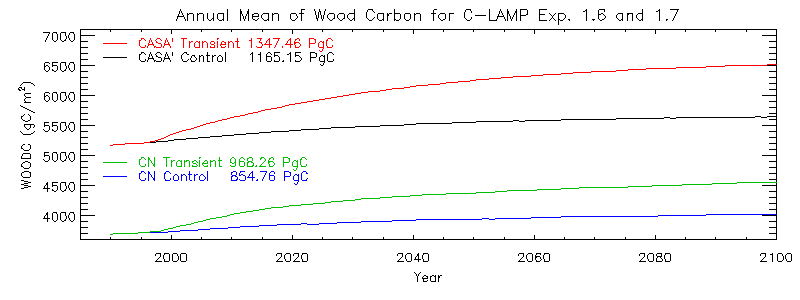
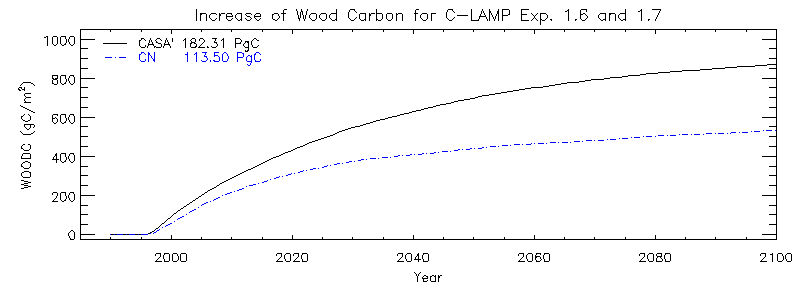
| Wood Carbon |
 |
 |
|
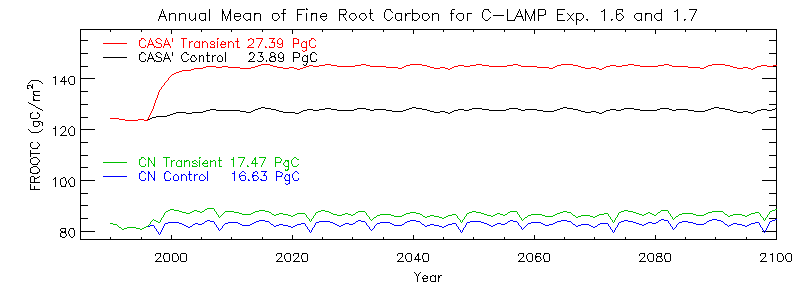
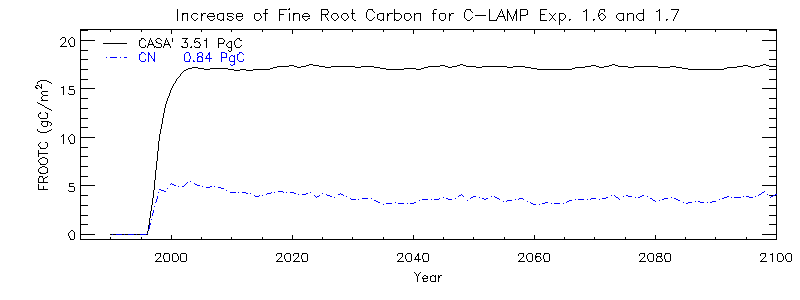
| Fine Root Carbon |
 |
 |
|
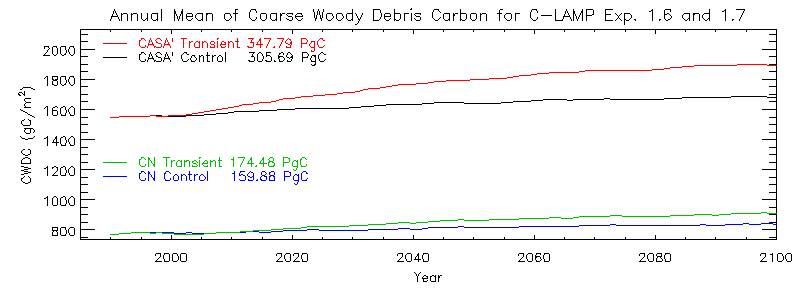
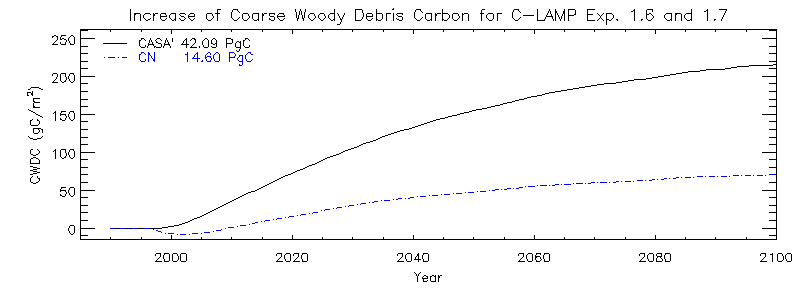
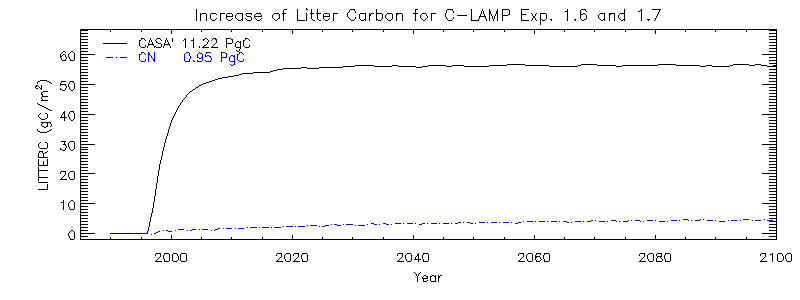
| Coarse Woody Debris Carbon |
 |
 |
|
| Litter Carbon |
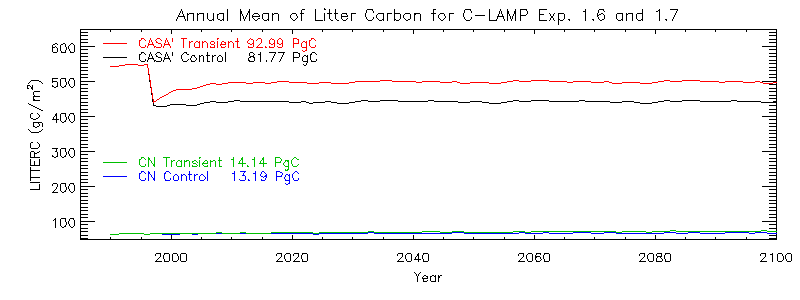 |
| Note: The sudden drop in litter carbon in the CASA′ simulations is due to the reassignment of a microbial pool from the litter group to the soil group in 1997. |
 |
|
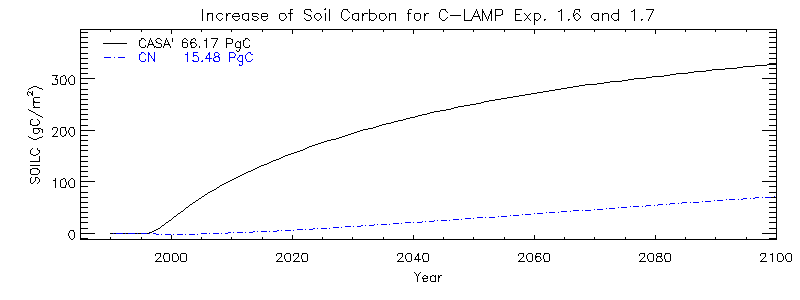
| Soil Carbon |
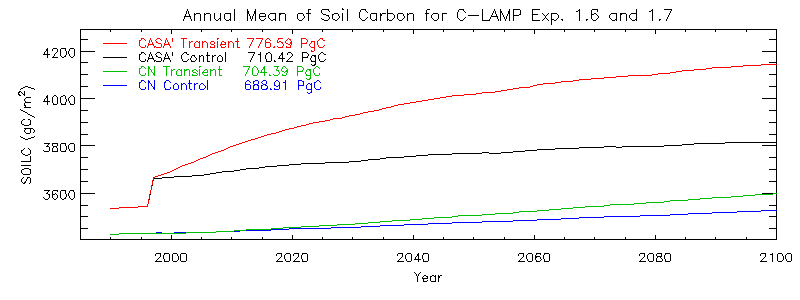 |
| Note: The sudden rise in soil carbon in the CASA′ simulations is due to the reassignment of a microbial pool from the litter group to the soil group in 1997. |
 |
|
Site-based FACE Analysis
Site Net Primary Production (NPP) Response
| Site Name |
Longitude (°E) |
Latitude (°N) |
Measurement |
CASA′ Model |
CN Model |
| NPP Increase |
βL |
NPP Increase |
βL |
Score |
NPP Increase |
βL |
Score |
| DukeFACE |
-79.08333 |
35.96666 |
28.0% |
0.69 |
16.4% |
0.41 |
0.26 |
6.2% |
0.15 |
0.65 |
| AspenFACE |
-89.61666 |
45.66666 |
35.2% |
0.87 |
15.6% |
0.39 |
0.39 |
12.4% |
0.31 |
0.48 |
| ORNL-FACE |
-84.33333 |
35.90000 |
23.9% |
0.59 |
17.3% |
0.43 |
0.16 |
5.2% |
0.13 |
0.64 |
| POP-EUROFACE |
11.80000 |
42.36666 |
21.8% |
0.54 |
20.0% |
0.49 |
0.04 |
5.7% |
0.14 |
0.59 |
| 4 Site Mean |
27.2% |
0.67 |
17.3% |
0.43 |
|
7.4% |
0.18 |
|
| Total M Score |
|
|
|
|
0.79 |
|
|
0.41 |
Sites on Global NPP Percent Change and βL Response Maps
| Percent Change in Net Primary Production (NPP) Between Transient and Control |
 |
 |
|
| βL Response Between Transient and Control |
 |
 |
|
FACE Site and Corresponding Grid Cell Characterization
| Site Name |
Longitude (°E) |
Latitude (°N) |
Overstory
Vegetation |
Nearest
Longitude (°E) |
Nearest
Latitude (°N) |
Plant Functional Types |
| DukeFACE |
-79.08333 |
35.96666 |
Evergreen loblolly pine (Pinus taeda L.) |
281.25000 |
34.88252 |
| 1.1% |
not vegetated |
| 33.1% |
needleleaf evergreen temperate tree |
| 14.5% |
broadleaf deciduous temperate tree |
| 0.4% |
broadleaf deciduous temperate shrub |
| 20.2% |
c3 non-arctic grass |
| 11.4% |
c4 grass |
| 19.3% |
corn |
|
| AspenFACE |
-89.61666 |
45.66666 |
Multispecies assemblage dominated by Populus spp. (Populus tremuloides Michx., Acer saccharum Marsh., Betula papyrifera Marsh.) |
270.00000 |
46.04473 |
| 4.5% |
not vegetated |
| 15.3% |
needleleaf evergreen temperate tree |
| 1.9% |
needleleaf evergreen boreal tree |
| 30.8% |
broadleaf deciduous temperate tree |
| 2.7% |
broadleaf deciduous boreal tree |
| 24.2% |
c3 non-arctic grass |
| 1.6% |
corn |
|
| ORNL-FACE |
-84.33333 |
35.90000 |
Deciduous sweetgum (Liquidambar styraciflua L.) |
275.62500 |
34.88252 |
| 23.3% |
needleleaf evergreen temperate tree |
| 0.1% |
needleleaf evergreen boreal tree |
| 28.9% |
broadleaf deciduous temperate tree |
| 0.1% |
broadleaf deciduous boreal tree |
| 26.3% |
c3 non-arctic grass |
| 8.3% |
c4 grass |
| 13.0% |
corn |
|
| POP-EUROFACE |
11.80000 |
42.36666 |
Multispecies assemblage dominated by Populus spp. (Populus alba L., P. nigra L., P × euramericana Dode Guinier) |
11.25000 |
43.25420 |
| 2.2% |
not vegetated |
| 13.3% |
needleleaf evergreen temperate tree |
| 0.3% |
needleleaf evergreen boreal tree |
| 11.0% |
broadleaf deciduous temperate tree |
| 0.8% |
broadleaf deciduous boreal tree |
| 3.8% |
broadleaf deciduous temperate shrub |
| 0.6% |
c3 arctic grass |
| 40.8% |
c3 non-arctic grass |
| 5.2% |
c4 grass |
| 22.1% |
corn |
|
|